Oct. 26, 2026XINSHENG


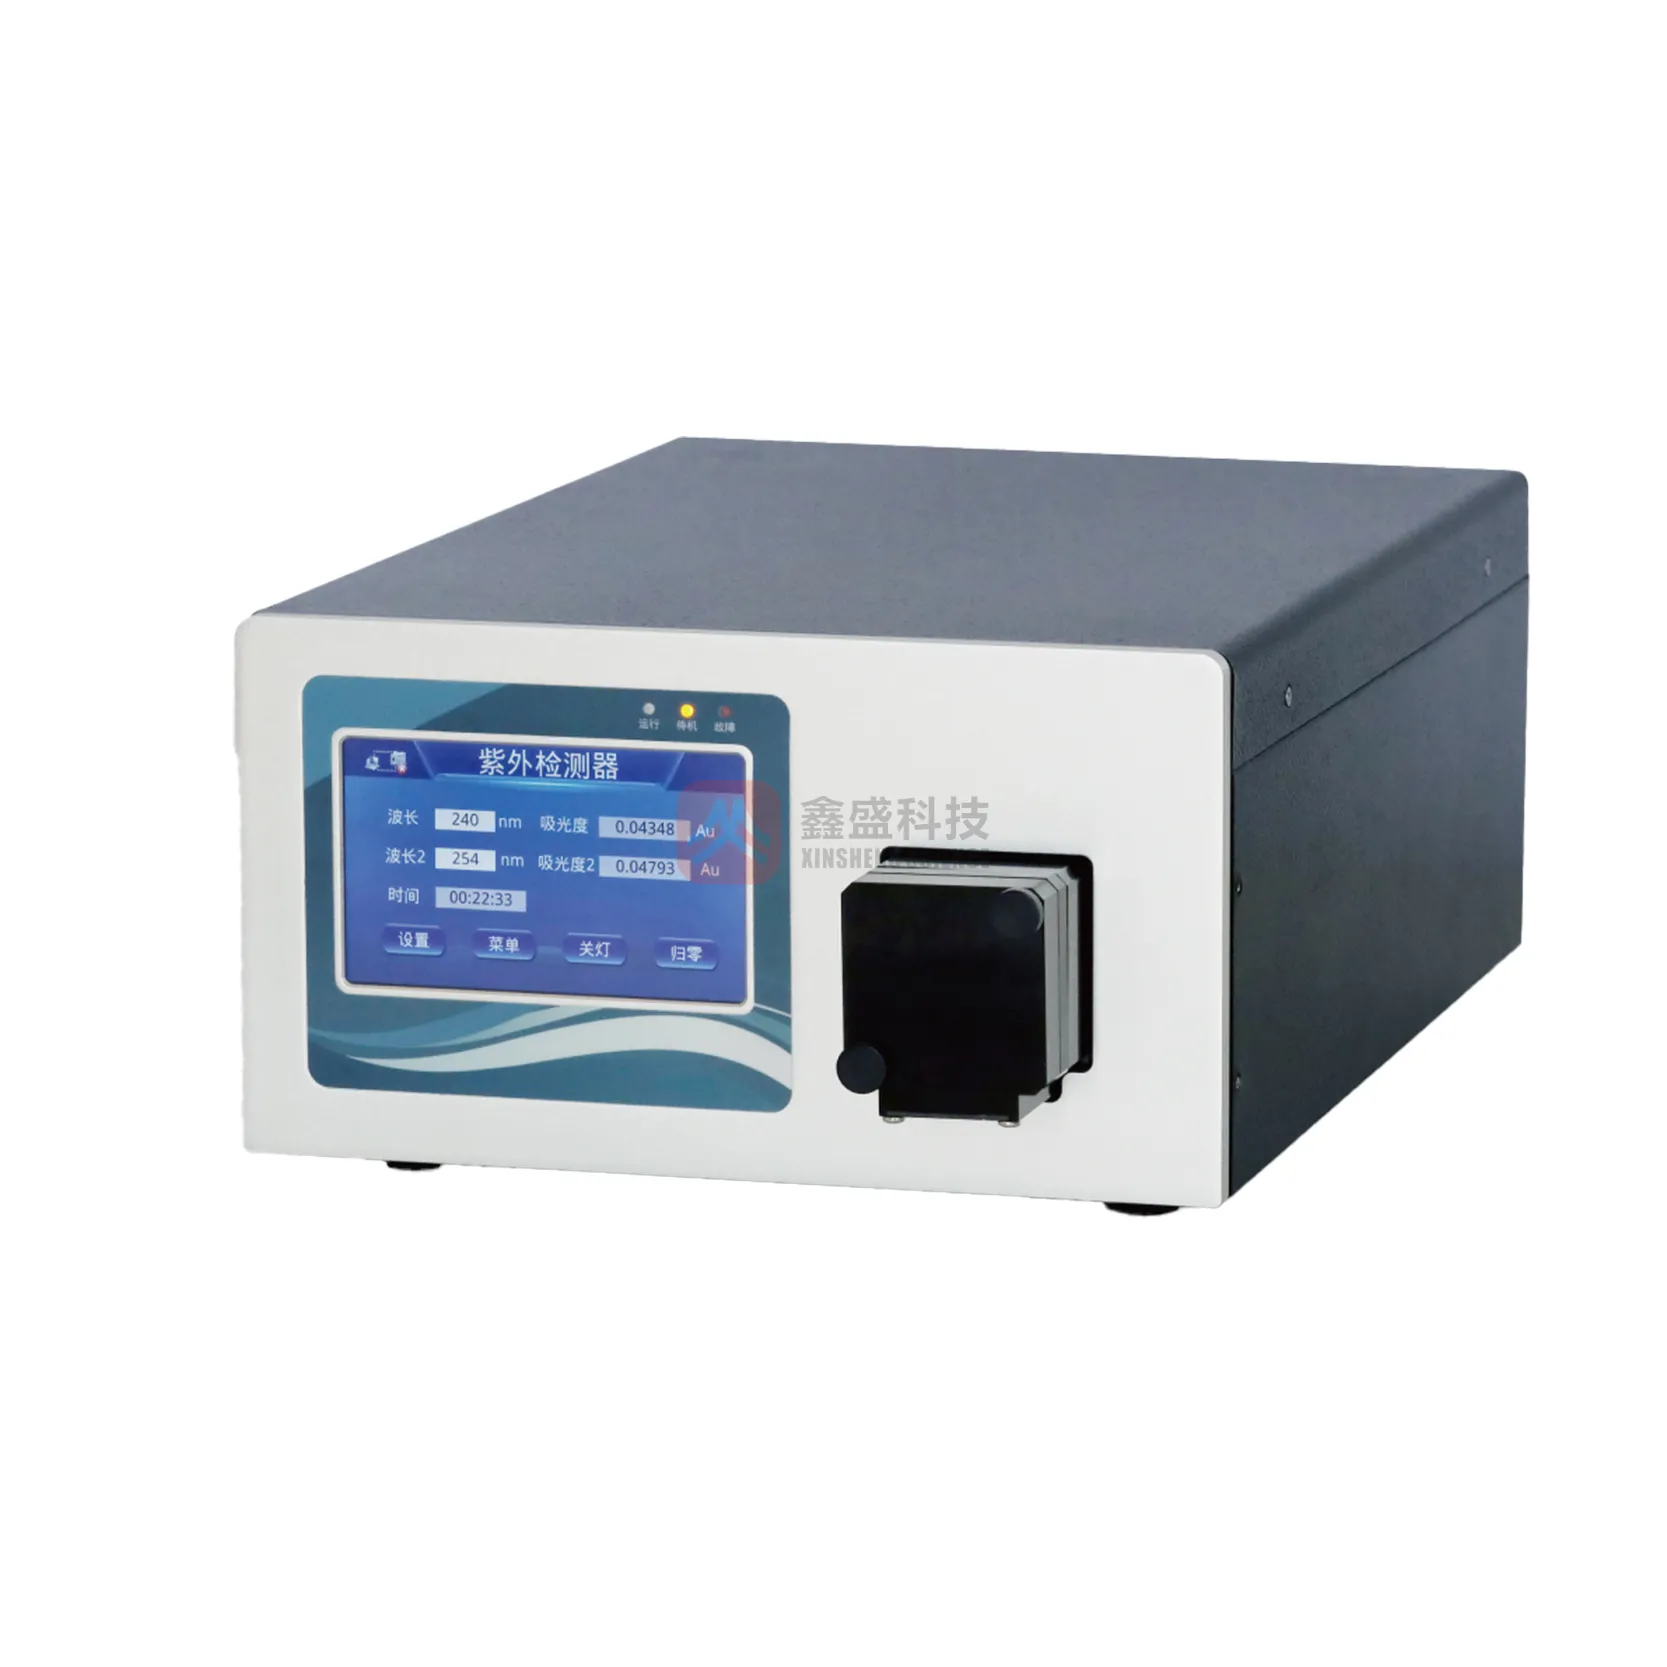
HPLC detector problems such as baseline drift, noise, and low sensitivity can hide peaks and make results unreliable. Mobile phase contamination is one possible cause of a changing or uneven chromatogram. A detector may also show problems after a column change, maintenance, or a change in room temperature. Lamp energy and wavelength settings can affect the response of a UV detector. Small leaks, poor mixing, and incorrect detector settings can create similar symptoms. Flow cell bubbles can cause sudden spikes, unstable readings, or a loss of signal.
This guide explains how to identify common faults and test likely causes before replacing parts. The checks apply to common UV, photodiode array, fluorescence, refractive index, and other HPLC Detectors.
To fix HPLC baseline drift, detector noise, or low sensitivity, first confirm the method and instrument settings. Then check the mobile phase, solvent mixing, degassing, flow cell, leaks, temperature, lamp condition, wavelength, and detector response. Change one factor at a time, compare results with the instrument specifications and method limits, and document each test. Do not replace a detector until simpler causes have been ruled out.
Start with the chromatogram. If the baseline moves gradually, check the mobile phase, gradient, temperature, and lamp stability. If the signal has sharp spikes or a rough trace, check for bubbles, electrical interference, leaks, and pump pulsation. If peaks are stable but too small, check the wavelength, sample concentration, injection volume, flow cell, and detector response. After each correction, run a blank and a known standard. Continue only when the result meets the method acceptance criteria.
Baseline drift is a slow rise or fall in the detector signal when no analyte peak is passing through the flow cell. It can distort integration and make low-level peaks harder to measure. The direction and timing of the drift often point to the cause.
Run the mobile phase at the method flow rate with no injection. Record the baseline over the same time period used for the method. Repeat the test with freshly prepared solvent if drift appears. For a gradient method, use the full gradient program. Compare the result with the method's baseline limit and the detector manufacturer's specification. There is no single drift limit that applies to every detector and method.
Detector noise is random or repeating variation in the signal. It can make a noisy HPLC chromatogram difficult to integrate and can hide small peaks. Noise may come from the detector, the pump, the solvent, the environment, or the sample.
Use fresh, clean solvents and filter them when required by the method and instrument instructions. Degas the mobile phase using a suitable online degasser or a validated preparation procedure. Purge solvent lines after changing bottles. Keep detector cables away from high-power electrical cables. Confirm that the instrument is correctly grounded. Use the detector's approved response time and data rate settings; excessive response speed can make random variation more visible, while excessive smoothing can distort peaks.
Measure noise under a defined condition, such as a stable mobile-phase blank, a stated time window, and the same data rate used for analysis. Report the units and test settings. Do not compare noise results from different instruments unless the measurement conditions are the same.
Low sensitivity means the detector produces a smaller response than expected for a known amount of analyte. The cause may be a detector fault, but it may also be a sample, method, or chromatography issue.
Inject a suitable reference standard at a known concentration and volume. Use the approved method and a stable system. Compare peak area or height with a historical control or method acceptance range. Repeat the injection to assess precision. For detection and quantitation limits, ICH Q2(R2) describes approaches that include signal-to-noise and calibration-curve methods. A signal-to-noise ratio near 3:1 is commonly used as an estimate for detection, while about 10:1 is commonly used for quantitation. These are common approaches, not universal acceptance limits for every method or product.
For a UV detector, a typical analytical flow cell may have a path length near 10 mm, but cell volume, path length, and pressure limits depend on the model. A longer optical path can increase absorbance response, but it can also increase band broadening if the cell volume is too large for the method. Use the flow cell specified for the instrument and application.
Different detectors respond to different properties of a compound. A troubleshooting check that works for a UV detector may not apply to a refractive index detector or an evaporative light scattering detector.
| Detector type | What it measures | Common problem | First checks |
|---|---|---|---|
| UV or visible absorbance | Light absorbed by compounds at a selected wavelength | Drift, noise, or weak peaks | Wavelength, lamp energy, solvent absorbance, bubbles, and flow cell cleanliness |
| Photodiode array detector | Absorbance across a range of wavelengths | Noisy spectra or incorrect peak response | Wavelength calibration, lamp status, spectral settings, and cell condition |
| Fluorescence detector | Light emitted after a compound is excited | Low response or unstable signal | Excitation and emission wavelengths, lamp, optical filters, and sample fluorescence |
| Refractive index detector | Difference in refractive index between sample and reference streams | Strong baseline drift | Temperature stability, solvent matching, flow stability, and bubbles |
| ELSD or CAD | Signal from particles formed after solvent removal or aerosol charging | Variable response or high background | Nebulizer, gas supply, evaporation conditions, solvent additives, and cleanliness |
UV and photodiode array detectors are affected by the UV absorbance of solvents and additives. Many instruments operate across a wavelength range that can extend from about 190 nm into the visible region, but the usable range depends on the model, lamp, and mobile phase. At low wavelengths, solvent purity and additive selection become especially important.
Refractive index detectors are highly sensitive to temperature and solvent composition. They are usually not suitable for gradient methods because changing solvent composition changes the background signal. Fluorescence detectors can offer strong response for naturally fluorescent compounds or compounds that have been derivatized, but the excitation and emission settings must match the analyte.
Good troubleshooting depends on repeatable tests. Keep a record of the detector model, software method, mobile phase, flow rate, temperature, wavelength, data rate, lamp hours, and date of each test. This information helps separate a real instrument change from a method or preparation change.
| Check | Useful record | How to use the result |
|---|---|---|
| Baseline stability | Drift and noise over a defined blank run | Compare with method limits and the detector specification |
| Standard response | Peak area or height from replicate injections | Compare with a control chart or approved response range |
| Wavelength accuracy | Verification result using an approved reference material or test filter | Confirm that the detector reads the intended wavelength |
| Photometric response | Absorbance result from a suitable certified reference material | Check response against the instrument procedure and tolerance |
| Lamp condition | Hours, energy reading, and self-test status | Use the manufacturer limits to decide whether service is needed |
USP General Chapter 621 covers chromatography procedures and system suitability concepts. ICH Q2(R2) describes analytical procedure validation, including performance characteristics such as detection and quantitation limits. For calibration and testing work, use the current approved laboratory procedure and suitable reference materials. An ISO/IEC 17025-accredited laboratory can provide testing within its stated scope, but accreditation does not replace method-specific acceptance criteria.
Do not open a detector housing or handle a lamp while the equipment is powered or hot. Follow the manufacturer's safety instructions. If the detector fails a self-test, has a persistent leak, or remains outside its stated performance limits after basic checks, contact qualified service personnel.
Service may be needed when baseline drift continues with fresh solvent and stable temperature, a standard response remains low after injection and method checks, wavelength verification fails, or the detector reports a persistent hardware error. Before requesting service, provide the model and serial number, error messages, lamp hours, test conditions, chromatograms, and steps already completed.
When evaluating support from a supplier such as XINSHENG, ask for written service scope, detector compatibility, response times, available spare parts, and examples of documented installation and qualification records. For a project with defined quantities, request measurable evidence such as the number of installations completed for the same detector family, the number of trained service staff, and the acceptance tests included. These records are more useful than broad claims about experience.
HPLC detector problems usually have a testable cause. Check the mobile phase, pump, flow cell, temperature, lamp, settings, sample, and method before replacing hardware. Use a blank and a known standard to confirm each correction, and compare results with method limits and manufacturer specifications. Careful records make it easier to resolve HPLC baseline drift, detector noise, and low sensitivity while protecting the quality of analytical results.
RELATED INFORMATION

 EN